 |
 |
Infographics help
to illustrate data.
|
Complex Data Shown Clearly
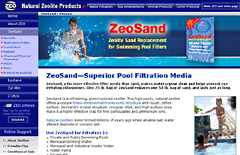
The design challenge involved organizing and presenting complex data for products targeting diverse markets using a clear, easy-to-use and easy-to-find interface. The content is extensive, substantive and is neither dumbed-down nor excessively cluttered. Infographics, charts, graphs and illustrations are used to clearly present test data and research study results. Product photos, taken by Skoubo Graphics, show the color and textural qualities distinct to each product. Within the website text, bold subheads make it easy for customers to scan for key topics. FAQs offer fast answers, and PDFs provide printable versions of all explanatory content so product distributors can access information quickly.
Navigate Easily
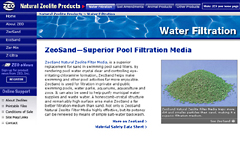
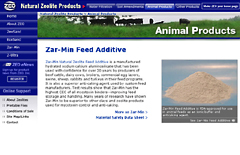
The global navigation is organized by both product name and application (Water Filtration, Soil Amendments, Animal Products), with additional corporate, online support and contact sections. The clear navigational hierarchy is clean, simple, consistent and kept partially hidden to keep the focus on the content of each section. Enabling visitors to access content with as few clicks as possible, all corporate and product resources are grouped into an Online Support area with a distinct graphic look that makes it easy to locate.  |
 |
|
|
|
|


