Infographics
HOME
ABOUT
NEWS/VIEWS
SERVICES
WEBSITES
FLASH
INFOGRAPHICS
Wireless Use
Online Travel
EcoSand Analysis
Byway Timeline
Bicycle Tour Map
DVD
INTERACTIVE TV
PHOTOGRAPHY
ILLUSTRATION
PRINT
CONTACT
Skoubo Graphics
W e b | C h a r t

Pie Chart Infographic

ZEO, Inc. is a leading producer of natural zeolite products, which are used in soil conditioning, water filtration and animal feed additives. With the use of extensive research and field trials, ZEO, Inc. has developed new products with improved results.

Their test and research data is displayed on the
ZEO website in the form of pie charts, graphs, tables, illustration and animation. The infographics used on their website show customers how ZEO's products can improve results in a range of industry applications.

Pie charts, such as the one shown here, are not typically used to compare scientific data, because it can be difficult to visually compare the pie slices. However, using the pie chart to illustrate the total composition of EcoSand, in conjunction with the percentage values displayed, leaves no doubt in the viewers mind as to the exact percentage of each element.


Infographics on ZEO Website
PIE CHART
PIE CHART: EcoSand Analysis >
ILLUSTRATION
ILLUSTRATION: Natural Zeolite Formation >
GRAPHS
GRAPH: Zar-Min Increased Egg Production >
GRAPH: Zar-Min Cumulative Eggs Increased Production >
GRAPH: More Eggs with Zar-Min Feed Additive >
GRAPH: Lower Mortality Zar-Min Feed Additive >
TABLES
TABLE: ZeoSand Superior Sand Replacement >
TABLE: Typical Properties of ZeoSand Natural Zeolite Filter Media >
TABLE: Chemical Analysis of ZeoSand Natural Zeolite Filter Media >
TABLE: EcoSand Soil Amendment Benefits >
TABLE: CEC Values as Reported by the University of Florida >
TABLE: EcoSand Greenhouse Research, Tomato Test Results >
TABLE: EcoSand Greenhouse Research, Sweet Bell Pepper Test Results >
TABLE: Typical Properties of Zar-Min Feed Additive >
TABLE: Better Performance with Zar-Min Feed Additive >
TABLE: Broiler Research, Improved Feed Efficiency with Zar-Min Feed Additive >
TABLE: Broiler Research, Trial Rations and Performance >
TABLE: Zar-Min Research with Ruminant Animals >
TABLE: Swine Research, Increased Growth Rate >
TABLE: Turkey Research, Improved Gain and Feed Efficiency >
TABLE: Turkey Research, Increased Growth Rate >
TABLE: Z-Ultra, Property and Uses >
P I EC H A R T
Infographic Pie Chart: Skoubo Graphics
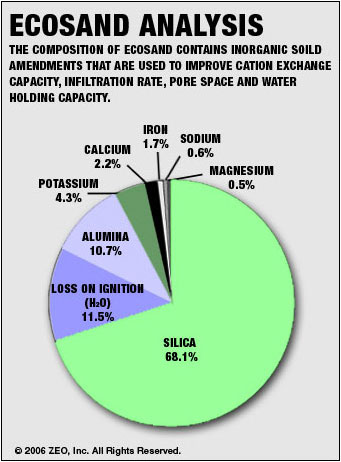
This infographic pie chart with percentage values displayed, illustrates the composition of EcoSand, a soil additive used to improve turf quality.

site map | support


About Skoubo Graphics :: Website Design :: Mobile Graphics :: Mobile Web :: Mobile Art :: Mobile Website :: Website Graphics :: Infographics :: Bar Chart Infographics :: Trend Chart Infographics :: Pie Chart Infographics :: Timeline Infographics :: Map Infographics :: Flash :: Flash Graphics :: Flash Galleries :: Flash Games :: Flash Banners :: Flash Animation :: Flash Art :: Flash Designers :: DVD Graphics :: Illustration :: Interactive Design :: Interactive TV :: Photography :: Illustration :: Print Graphics :: Advertising Graphics :: Brochure Graphics :: Poster Graphics :: Educational Graphics :: Corporate ID Graphics :: Business Graphics :: Graphic News :: Technology News :: Contact Skoubo Graphics